Oracle. The impact of a commit on task execution time.

Many probably know that frequent commits are bad and slow, but how bad and how slow is not clear, and this small test is designed to demonstrate the impact of this event.

I’ll note right away that commits should be made exactly when the business process requires it, or when there is any other significant reason, rather than just ‘in case.’

Test environment:

Oracle 19.23

OS: OEL 8.5 4.18.0-513.24.1.el8_9.x86_64

RAM: 128GB

CPU: AMD Threadripper 1920x

Disks:

Disk group for data files: +ORADATA: SATA SSD GeIL R3 512GB

Disk group for redo logs: +ADATAD1: XPG GAMMIX S11 Pro PCI E 3.0 x4

Disk group for archive logs: +ARCHLOG: SATA SSD GeIL R3 512GB

+ORADATA and +ARCHLOG are located on the same physical disk SATA SSD GeIL R3 512GB.

The code that will act as the load (intensive business process activity):

Variant 1:

declare
v_loop number;
v_seq number;
v_text varchar2(3000);
v_rtext varchar2(3000);
begin
  execute immediate 'truncate table t1';
  dbms_output.put_line('Start: '||to_char(sysdate,'dd.mm.yyyy hh24:mi:ss'));
  dbms_workload_repository.create_snapshot;
  v_loop:=1;
  select dbms_random.string(opt => 'X',len => 3000) into v_rtext from dual;
  while v_loop<5000001
    loop
      v_seq:=t1_seq.nextval;
      insert into t1(id,text) values(v_seq,v_rtext);
      commit write wait;
      select t1.text into v_text from t1 where id=v_seq;
      update t1 set t1.text='update' where id=v_seq;
      commit write wait;
      delete from t1 where id=v_seq;
      commit write wait;
      v_loop:=v_loop+1;
      end loop;
      dbms_workload_repository.create_snapshot;
      dbms_output.put_line('End: '||to_char(sysdate,'dd.mm.yyyy hh24:mi:ss'));
   end;

Variant 2:

declare
v_loop number;
v_seq number;
v_text varchar2(3000);
v_rtext varchar2(3000);
begin
  execute immediate 'truncate table t1';
  dbms_output.put_line('Start: '||to_char(sysdate,'dd.mm.yyyy hh24:mi:ss'));
  dbms_workload_repository.create_snapshot;
  v_loop:=1;
  select dbms_random.string(opt => 'X',len => 3000) into v_rtext from dual;
  while v_loop<5000001
    loop
      v_seq:=t1_seq.nextval;
      insert into t1(id,text) values(v_seq,v_rtext);
      select t1.text into v_text from t1 where id=v_seq;
      update t1 set t1.text='update' where id=v_seq;
      delete from t1 where id=v_seq;
      commit write wait;
      v_loop:=v_loop+1;
      end loop;
      dbms_workload_repository.create_snapshot;
      dbms_output.put_line('End: '||to_char(sysdate,'dd.mm.yyyy hh24:mi:ss'));
   end;

The difference between the first and second options is that the first option has 3 commits within the loop, while the second has 1 commit within the loop. Also, the ‘commit write wait’ construct is chosen to avoid PL/SQL optimization, as this commit variant is used if the code is not written in PL/SQL.

Variant 1 took 23 minutes and 6 seconds (1386 seconds) to complete.

Variant 2 took 12 minutes and 51 seconds (771 seconds) to complete.

Variant 3 (commit executed only at the end of the loop) took 503 seconds, but it’s not considered for evaluation.

So, Variant 2 is nearly twice as fast.

Reasons why Variant 1 took longer:

Further calculations are done with a certain margin of error, and it is assumed that all statistics relate only to the tasks being performed.

Variant 1 took 501 seconds for log file sync (lfs) out of 1386 seconds, while variant 2 took 192 seconds for log file sync (lfs) out of 771 seconds. By subtracting 501 from 1386, we get 885 seconds. Mathematically excluding all intermediate commits in the loop from variant 1, it still takes more time than variant 2, with 885 seconds versus 771 seconds.

Graph of the number of SQL statement executions per second for ‘Variant 1,’ ‘Variant 2,’ and ‘Variant 3’:

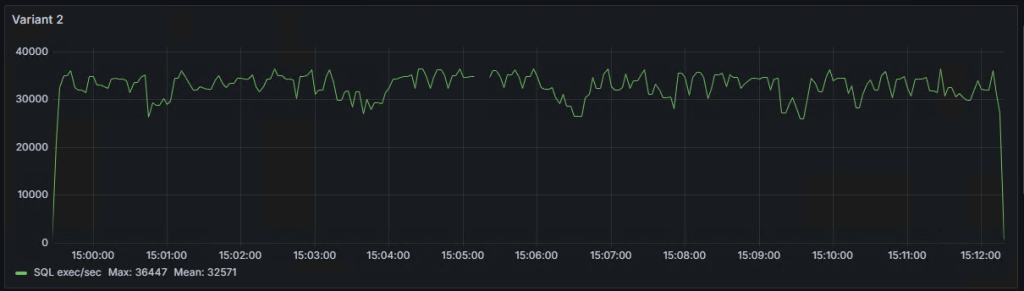
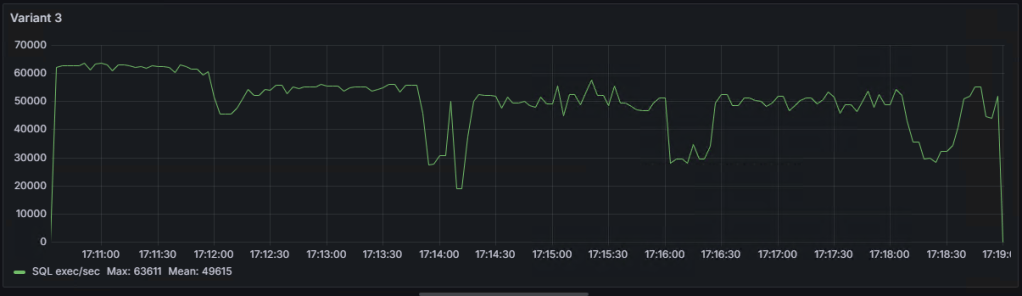
As seen on the graphs, there are some ‘dips,’ the explanations for which I will try to provide in the following note.

AWR reports for ‘Variant 1,’ ‘Variant 2,’ ‘Variant 3,’ and AWR comparison between ‘Variant 1’ vs ‘Variant 2’.

Oracle. Влияние коммита на время выполнения задачи.

Многие наверно знают, что частые коммиты — это плохо и медленно, но насколько плохо и насколько медленно, не понятно и данный маленький тест призван показать влияние этого события.

Сразу отмечу, что выполнять коммит нужно ровно тогда, когда этого требует бизнес-процесс, либо имеется любая другая веская причина, а не просто “на всякий случай”.

Тестовый стенд:

Oracle 19.23

OS: OEL 8.5 4.18.0-513.24.1.el8_9.x86_64

RAM: 128GB

CPU: AMD Threadripper 1920x

Диски:

Дисковая группа для датафайлов: +ORADATA: SATA SSD GeIL R3 512GB

Дисковая группа для редологов:    +ADATAD1: XPG GAMMIX S11 Pro PCI E 3.0 х4

Дисковая группа для архивных логов: +ARCHLOG: SATA SSD GeIL R3 512GB

+ORADATA и +ARCHLOG расположены на одном физическом диске SATA SSD GeIL R3 512GB.

Код, который будет выступать в виде нагрузки (бурной деятельности бизнес-процессов):

Вариант номер 1:

declare
v_loop number;
v_seq number;
v_text varchar2(3000);
v_rtext varchar2(3000);
begin
  execute immediate 'truncate table t1';
  dbms_output.put_line('Start: '||to_char(sysdate,'dd.mm.yyyy hh24:mi:ss'));
  dbms_workload_repository.create_snapshot;
  v_loop:=1;
  select dbms_random.string(opt => 'X',len => 3000) into v_rtext from dual;
  while v_loop<5000001
    loop
      v_seq:=t1_seq.nextval;
      insert into t1(id,text) values(v_seq,v_rtext);
      commit write wait;
      select t1.text into v_text from t1 where id=v_seq;
      update t1 set t1.text='update' where id=v_seq;
      commit write wait;
      delete from t1 where id=v_seq;
      commit write wait;
      v_loop:=v_loop+1;
      end loop;
      dbms_workload_repository.create_snapshot;
      dbms_output.put_line('End: '||to_char(sysdate,'dd.mm.yyyy hh24:mi:ss'));
   end;

Вариант номер 2:

declare
v_loop number;
v_seq number;
v_text varchar2(3000);
v_rtext varchar2(3000);
begin
  execute immediate 'truncate table t1';
  dbms_output.put_line('Start: '||to_char(sysdate,'dd.mm.yyyy hh24:mi:ss'));
  dbms_workload_repository.create_snapshot;
  v_loop:=1;
  select dbms_random.string(opt => 'X',len => 3000) into v_rtext from dual;
  while v_loop<5000001
    loop
      v_seq:=t1_seq.nextval;
      insert into t1(id,text) values(v_seq,v_rtext);
      select t1.text into v_text from t1 where id=v_seq;
      update t1 set t1.text='update' where id=v_seq;
      delete from t1 where id=v_seq;
      commit write wait;
      v_loop:=v_loop+1;
      end loop;
      dbms_workload_repository.create_snapshot;
      dbms_output.put_line('End: '||to_char(sysdate,'dd.mm.yyyy hh24:mi:ss'));
   end;

Отличие первого и второго варианта в том, что первый вариант имеет 3 коммита в цикле, а второй 1 коммит в цикле. Также, конструкция commit write wait выбрана для того, чтобы избежать оптимизации PL/SQL, т.к. данный вариант коммита применяется если код написан не на PL/SQL.

Вариант 1, выполнился за 23 минуты и 6 секунд(1386 секунд)

Вариант 2, выполнился за 12 минут и 51 секунду(771 секунд).

В не зачёта: Вариант 3(коммит выполняется только по окончанию цикла), выполнился за 503 секунды.

Т.е. вариант 2 быстрее почти в 2 раза.

На что вариант 1 потратил время(почему он медленнее):

Далее расчеты делаются с определённой погрешностью и предполагается, что все статистики относятся только к выполняемым задачам.

Вариант 1 из 1386 секунд, потратил на log file sync(lfs) 501 сек, а вариант 2 из 771 секунд, потратил на log file sync(lfs) 192 сек. Отняв от 1386, 501, получим 885 сек, т.е. математически исключим все промежуточные коммиты в цикле из варианта 1, всё равно вариант 1  затрачивает времени больше, чем вариант 2, 885сек против 771сек.

График количества выполнений SQL выражений в секунду для “вариант 1”,“вариант 2” и “вариант 3”:


Как видно на графиках, есть некие “провалы”, объяснения которым я попробую дать в следующей заметке.

AWR отчеты для “вариант 1”, “вариант 2”, “вариант 3” и AWR сравнение “вариант 1” vs “вариант 2”:

Unexplained growth a table size. Oracle 19.19, bug 30265523.

Given: Oracle 19.19, RHEL8, block size 8k.

After installing DBRU19.19 on 19.9, one table started to grow linearly. The table is a buffer, with insertion and almost immediate deletion. The table consistently holds around 1000 rows, but its volume increases every day. Upon searching on Oracle Support, Bug 30265523 was found — blocks are not marked as free in Automatic Segment Space Management (ASSM) after deletion — 12.2 and later (Doc ID 30265523.8).

After dumping the first level bitmap block of free space in the extent, I see the following picture:

--------------------------------------------------------

  DBA Ranges :

  --------------------------------------------------------

   0x04000080  Length: 64     Offset: 0     


   0:Metadata   1:Metadata   2:FULL   3:FULL
   4:FULL   5:FULL   6:FULL   7:FULL
   8:FULL   9:FULL   10:FULL   11:FULL
   12:FULL   13:FULL   14:FULL   15:FULL
   16:FULL   17:FULL   18:FULL   19:FULL
   20:FULL   21:FULL   22:FULL   23:FULL
   24:FULL   25:FULL   26:FULL   27:FULL
   28:FULL   29:FULL   30:FULL   31:FULL
   32:FULL   33:FULL   34:FULL   35:FULL
   36:FULL   37:FULL   38:FULL   39:FULL
   40:FULL   41:FULL   42:FULL   43:FULL
   44:FULL   45:FULL   46:FULL   47:FULL
   48:FULL   49:FULL   50:FULL   51:FULL
   52:FULL   53:FULL   54:FULL   55:FULL
   56:FULL   57:FULL   58:FULL   59:FULL
   60:FULL   61:FULL   62:FULL   63:FULL

  --------------------------------------------------------
  ktspfsc -
  nro:62 ncmp:0 nff:62 nxo:1 lastxs:30 nxid:1 ff:30
  clntime: 1689652737 addtime:0 spare1:0 spare2:0
  ro: rejection opcode, xo: xid offset List
  0. ro:0 xo:-1  1. ro:0 xo:-1  2. ro:3 xo:-1  3. ro:3 xo:-1
  4. ro:3 xo:-1  5. ro:3 xo:-1  6. ro:3 xo:-1  7. ro:3 xo:-1
  8. ro:3 xo:-1  9. ro:3 xo:-1  10. ro:3 xo:-1  11. ro:3 xo:-1
  12. ro:3 xo:-1  13. ro:3 xo:-1  14. ro:3 xo:-1  15. ro:3 xo:-1
  16. ro:3 xo:-1  17. ro:3 xo:-1  18. ro:3 xo:-1  19. ro:3 xo:-1
  20. ro:3 xo:-1  21. ro:3 xo:-1  22. ro:3 xo:-1  23. ro:3 xo:-1
  24. ro:3 xo:-1  25. ro:3 xo:-1  26. ro:3 xo:-1  27. ro:3 xo:-1
  28. ro:3 xo:-1  29. ro:3 xo:-1  30. ro:3 xo:-1  31. ro:3 xo:-1
  32. ro:3 xo:-1  33. ro:3 xo:-1  34. ro:3 xo:-1  35. ro:3 xo:-1
  36. ro:3 xo:-1  37. ro:3 xo:-1  38. ro:3 xo:-1  39. ro:3 xo:-1
  40. ro:3 xo:30  41. ro:3 xo:-1  42. ro:3 xo:-1  43. ro:3 xo:-1
  44. ro:3 xo:-1  45. ro:3 xo:-1  46. ro:3 xo:-1  47. ro:3 xo:-1
  48. ro:3 xo:-1  49. ro:3 xo:-1  50. ro:3 xo:-1  51. ro:3 xo:-1
  52. ro:3 xo:-1  53. ro:3 xo:-1  54. ro:3 xo:-1  55. ro:3 xo:-1
  56. ro:3 xo:-1  57. ro:3 xo:-1  58. ro:3 xo:-1  59. ro:3 xo:-1
  60. ro:3 xo:-1  61. ro:3 xo:-1  62. ro:3 xo:-1  63. ro:3 xo:-1


We observe rejection code 3, and all blocks are marked as FULL. This fully coincides with the description of the bug, which supposedly has been fixed. If we dump a block with data, there will be only one row in it, marked as deleted (—HDFL—). It is worth noting that the problematic table has several varchar2(4000) fields, out of which always two fields are filled up to the brim, and sometimes three fields, while the rest are always null. The table does not have any chained and migrated rows.

Further experiments have shown that:

  • Disabling or setting _enable_rejection_cache = false does not help or worsens the situation.
  • Disabling _assm_segment_repair_bg=false does not help either.
  • The combination of _enable_rejection_cache = false and _fix_control=’32075777:ON’ does not help either.
  • The potential solution (a workaround) may only be setting one parameter: _fix_control=’32075777:ON’.


Setting _fix_control=’32075777:ON’ has helped maintain the table within normal size limits. Under constant load, the table stopped growing. With the same load, in 19.9 the table had a size of a couple of hundred megabytes, while in 19.19 with _fix_control=’32075777:ON’, the growth stopped at around 1GB. Also, upon setting _fix_control=’32075777:ON’, a non-zero metric ASSM_bg_slave_fix_state appeared, which apparently increases after fixing the status of blocks in the bitmap, and x$ktsp_repair_list started to fill up (I assume this displays a list of segments on which the segment repair mechanism has been activated). I have opened an SR.


Overall, how has the operation of ASSM changed? Before 06/21, the database was running on DBRU 19.9, and after  6/20, on 19.19.

SMON. Slow Rollback of Dead Transactions


Issue: There is a dead transaction rolling back at a rate of 1-2 blocks per second, blocking the execution of update/delete/insert with a wait for transaction (event#=1074, name=transaction). Oracle Version: 19.21.


Since transaction rollback can take a considerable amount of time, it’s essential to assist this process. To do this, you need to drop the object associated with the transaction causing the slow rollback. How to determine the object that needs to be dropped? This might not be straightforward because the transaction could involve multiple tables. In my case, I enabled tracing 10046 for the SMON process, in which there were waits like ‘enq: CR — block range reuse ckpt’ obj#=MyProblematicObject. Additionally, I dumped the header of the undo segment (alter system dump undo header «_SegmentName») and the undo blocks associated with the transaction (alter system dump undo block «_SegmentName» XID number_USN number_SLT number_SEQ).

Where do we get what?

USN, SLT,SEQ-  from select * from v$fast_start_transactions
_SegmentName- from Select * from v$rollname where usn = USN

In the dump of blocks associated with the transaction, there is a lot of this:

KTSL - LOB Persistent Undo Block (PUB) undo record.

There are suspicions that KTSL stands for Kernel Transaction Segment LOB, but this is not certain. In the dump of the undo header and in the dump of blocks associated with the transaction, there should be a connection as follows: in the undo segment header in the TRN TBL section, the cmt column has a value of 0, and in the dba column at the same level, there are coordinates of the block. Dumping this block, we will enter the UBA, which is associated with ‘alter system dump undo block «_SegmentName» XID number_USN number_SLT number_SEQ’

After analyzing a lot of text, I select the necessary object and drop it.))

alter system set "_smu_debug_mode"=1024;
oradebug setospid <ospid of SMON process> 
oradebug event 10513 trace name context forever, level 2
drop table owner.table purge;
purge recyclebin;
oradebug event 10513 trace name context off
alter system set "_smu_debug_mode"=0;

Also, I used fast_start_parallel_rollback=false; (changing this parameter can stop the rollback process, either the instance needs to be restarted or attempt to revive SMON)

Useful notes:

Database Hangs Because SMON Is Taking 100% CPU Doing Transaction Recovery (Doc ID 414242.1)
IF: Transaction Recovery or Rollback of Dead Transactions (Doc ID 1951738.1)

I would like to highlight:

Bug 11790175 — SMON spins in rollback of LOB due to double allocated block like bug 11814891 (Doc ID 11790175.8)

This is an ancient bug, the description of which in my case coincides only on two criteria: Slow rollback Problematic object is LOB.

UNDO and REDO, a complex topic… perhaps there is a simpler method.